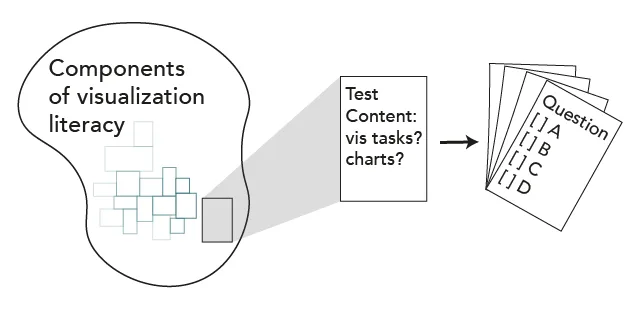
We contribute an autoethnographic reflection on the complexity of defining and measuring visualization literacy (i.e., the ability to interpret and construct visualizations) to expose our tacit thoughts that often exist in-between polished works and remain unreported in individual research papers. Our work is inspired by the growing number of empirical studies in visualization research that rely on visualization literacy as a basis for developing effective data representations or educational interventions. Researchers have already made various efforts to assess this construct, yet it is often hard to pinpoint either what we want to measure or what we are effectively measuring.
MetroFlow: Visualizing Bioinformatics Workflow Source Code as Interactive Metro-Maps
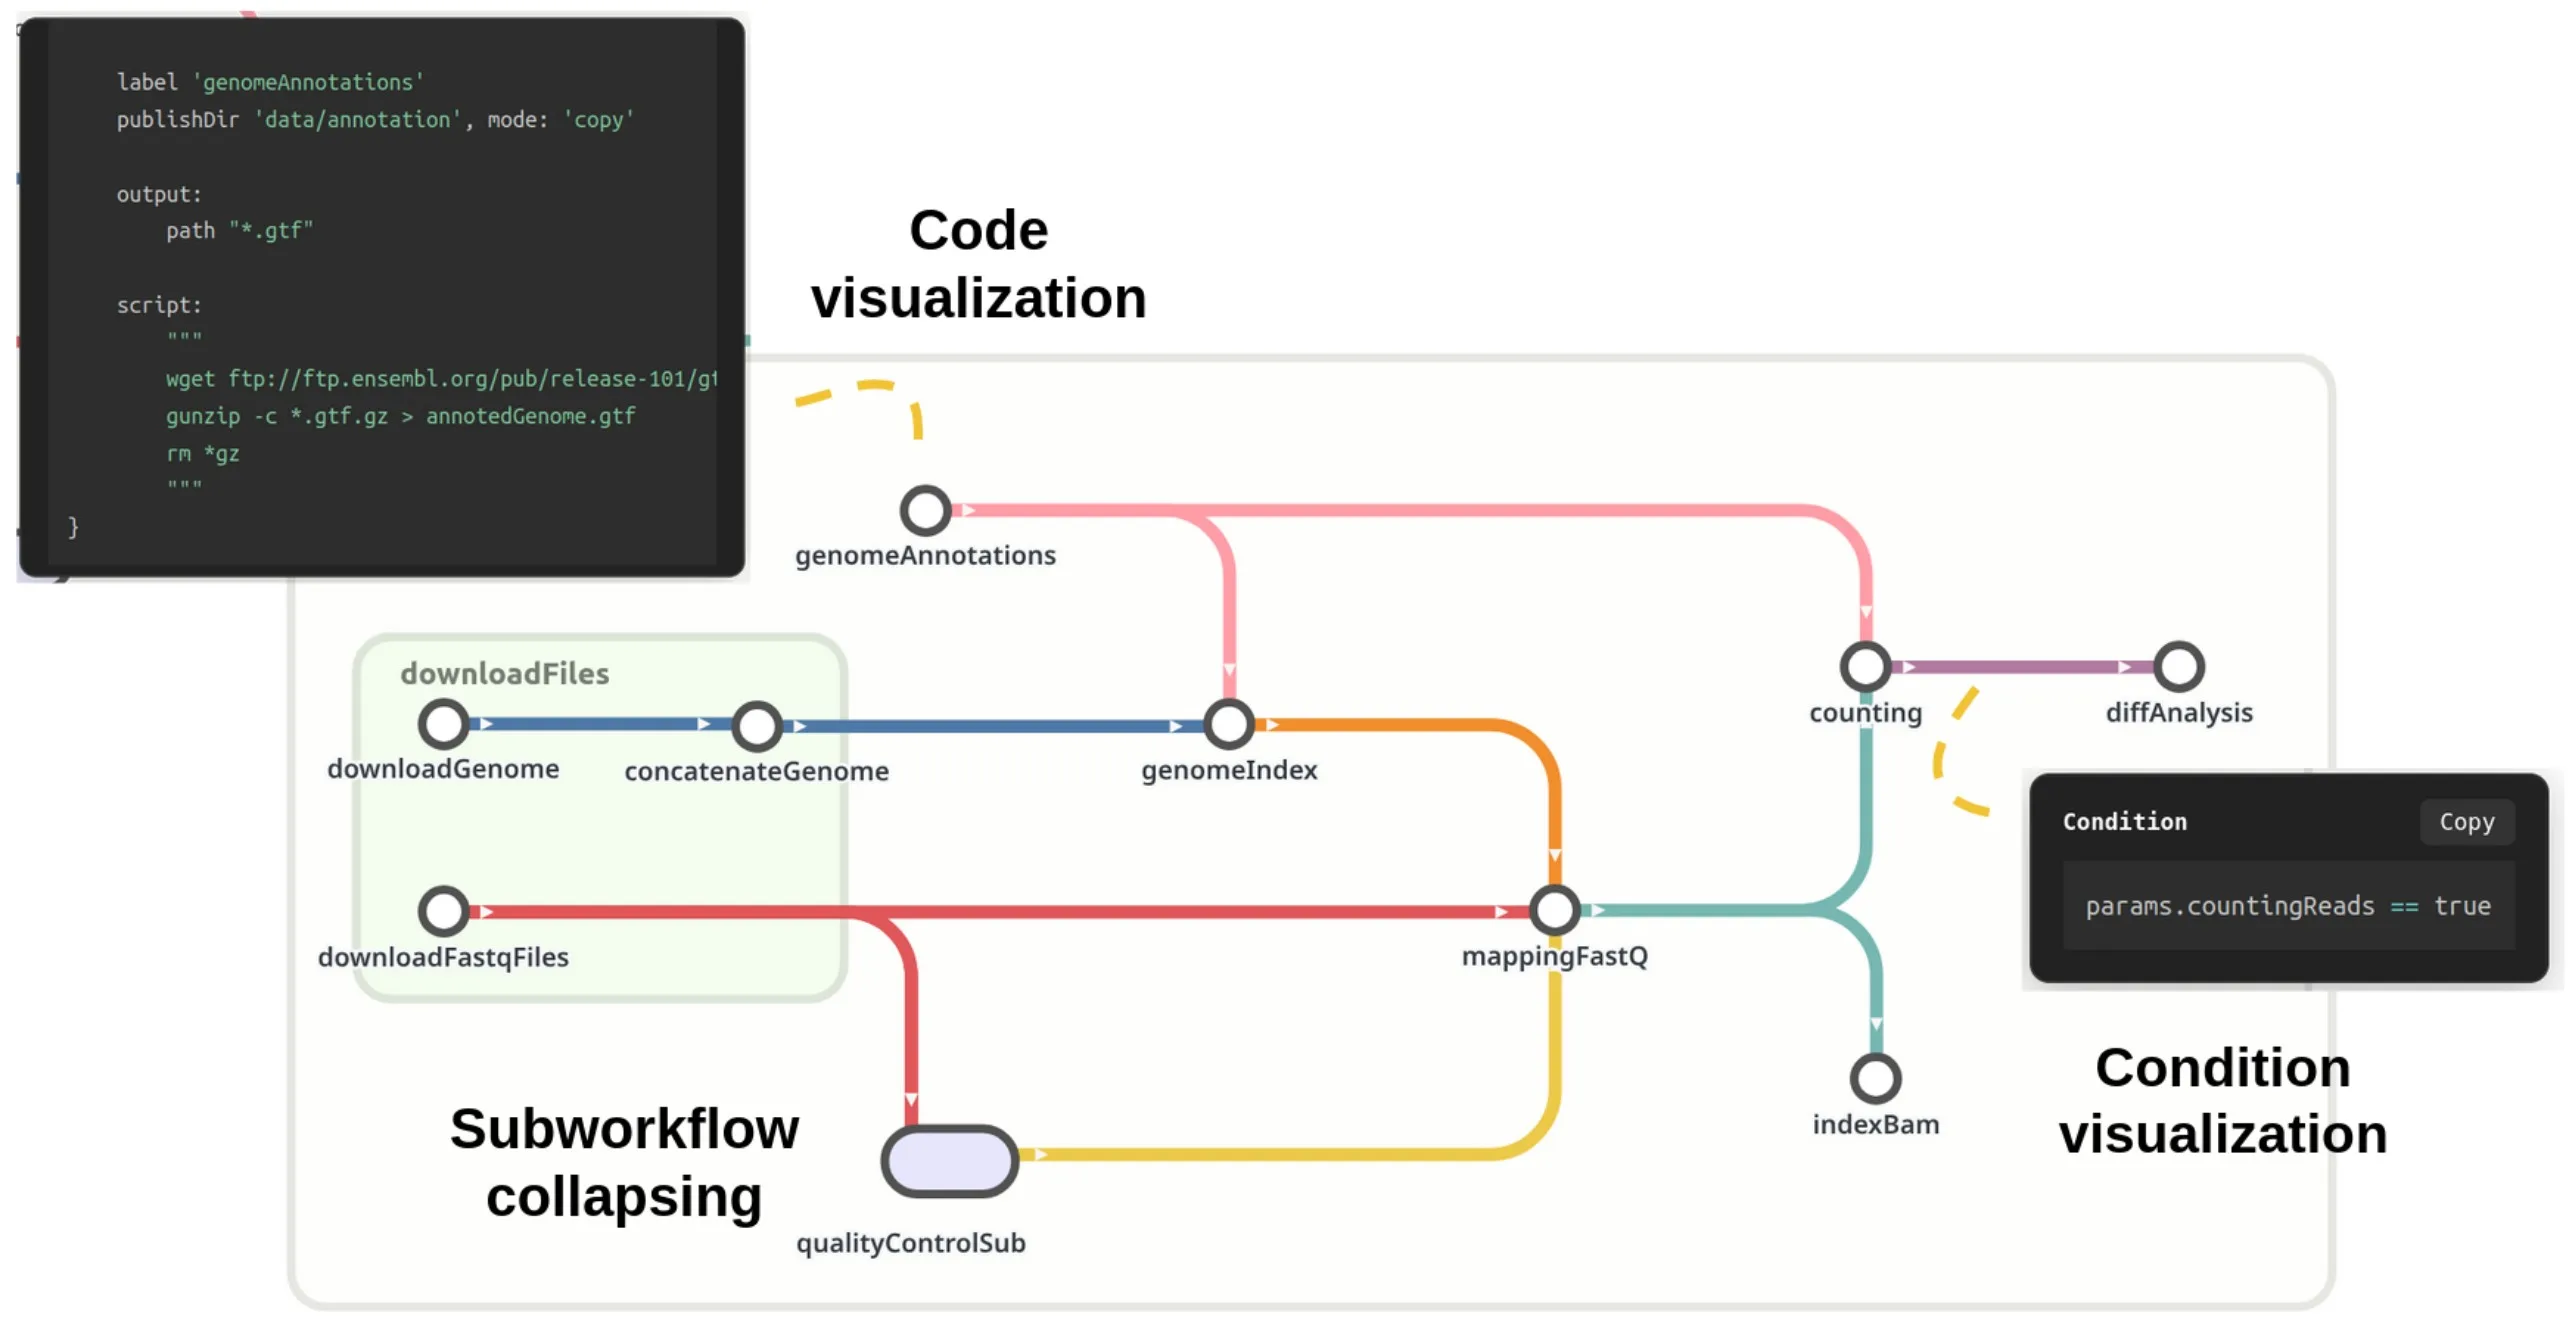
We present MetroFlow, a tool that automatically generates interactive metro-map representations of bioinformatics workflows. Continue reading MetroFlow: Visualizing Bioinformatics Workflow Source Code as Interactive Metro-Maps
