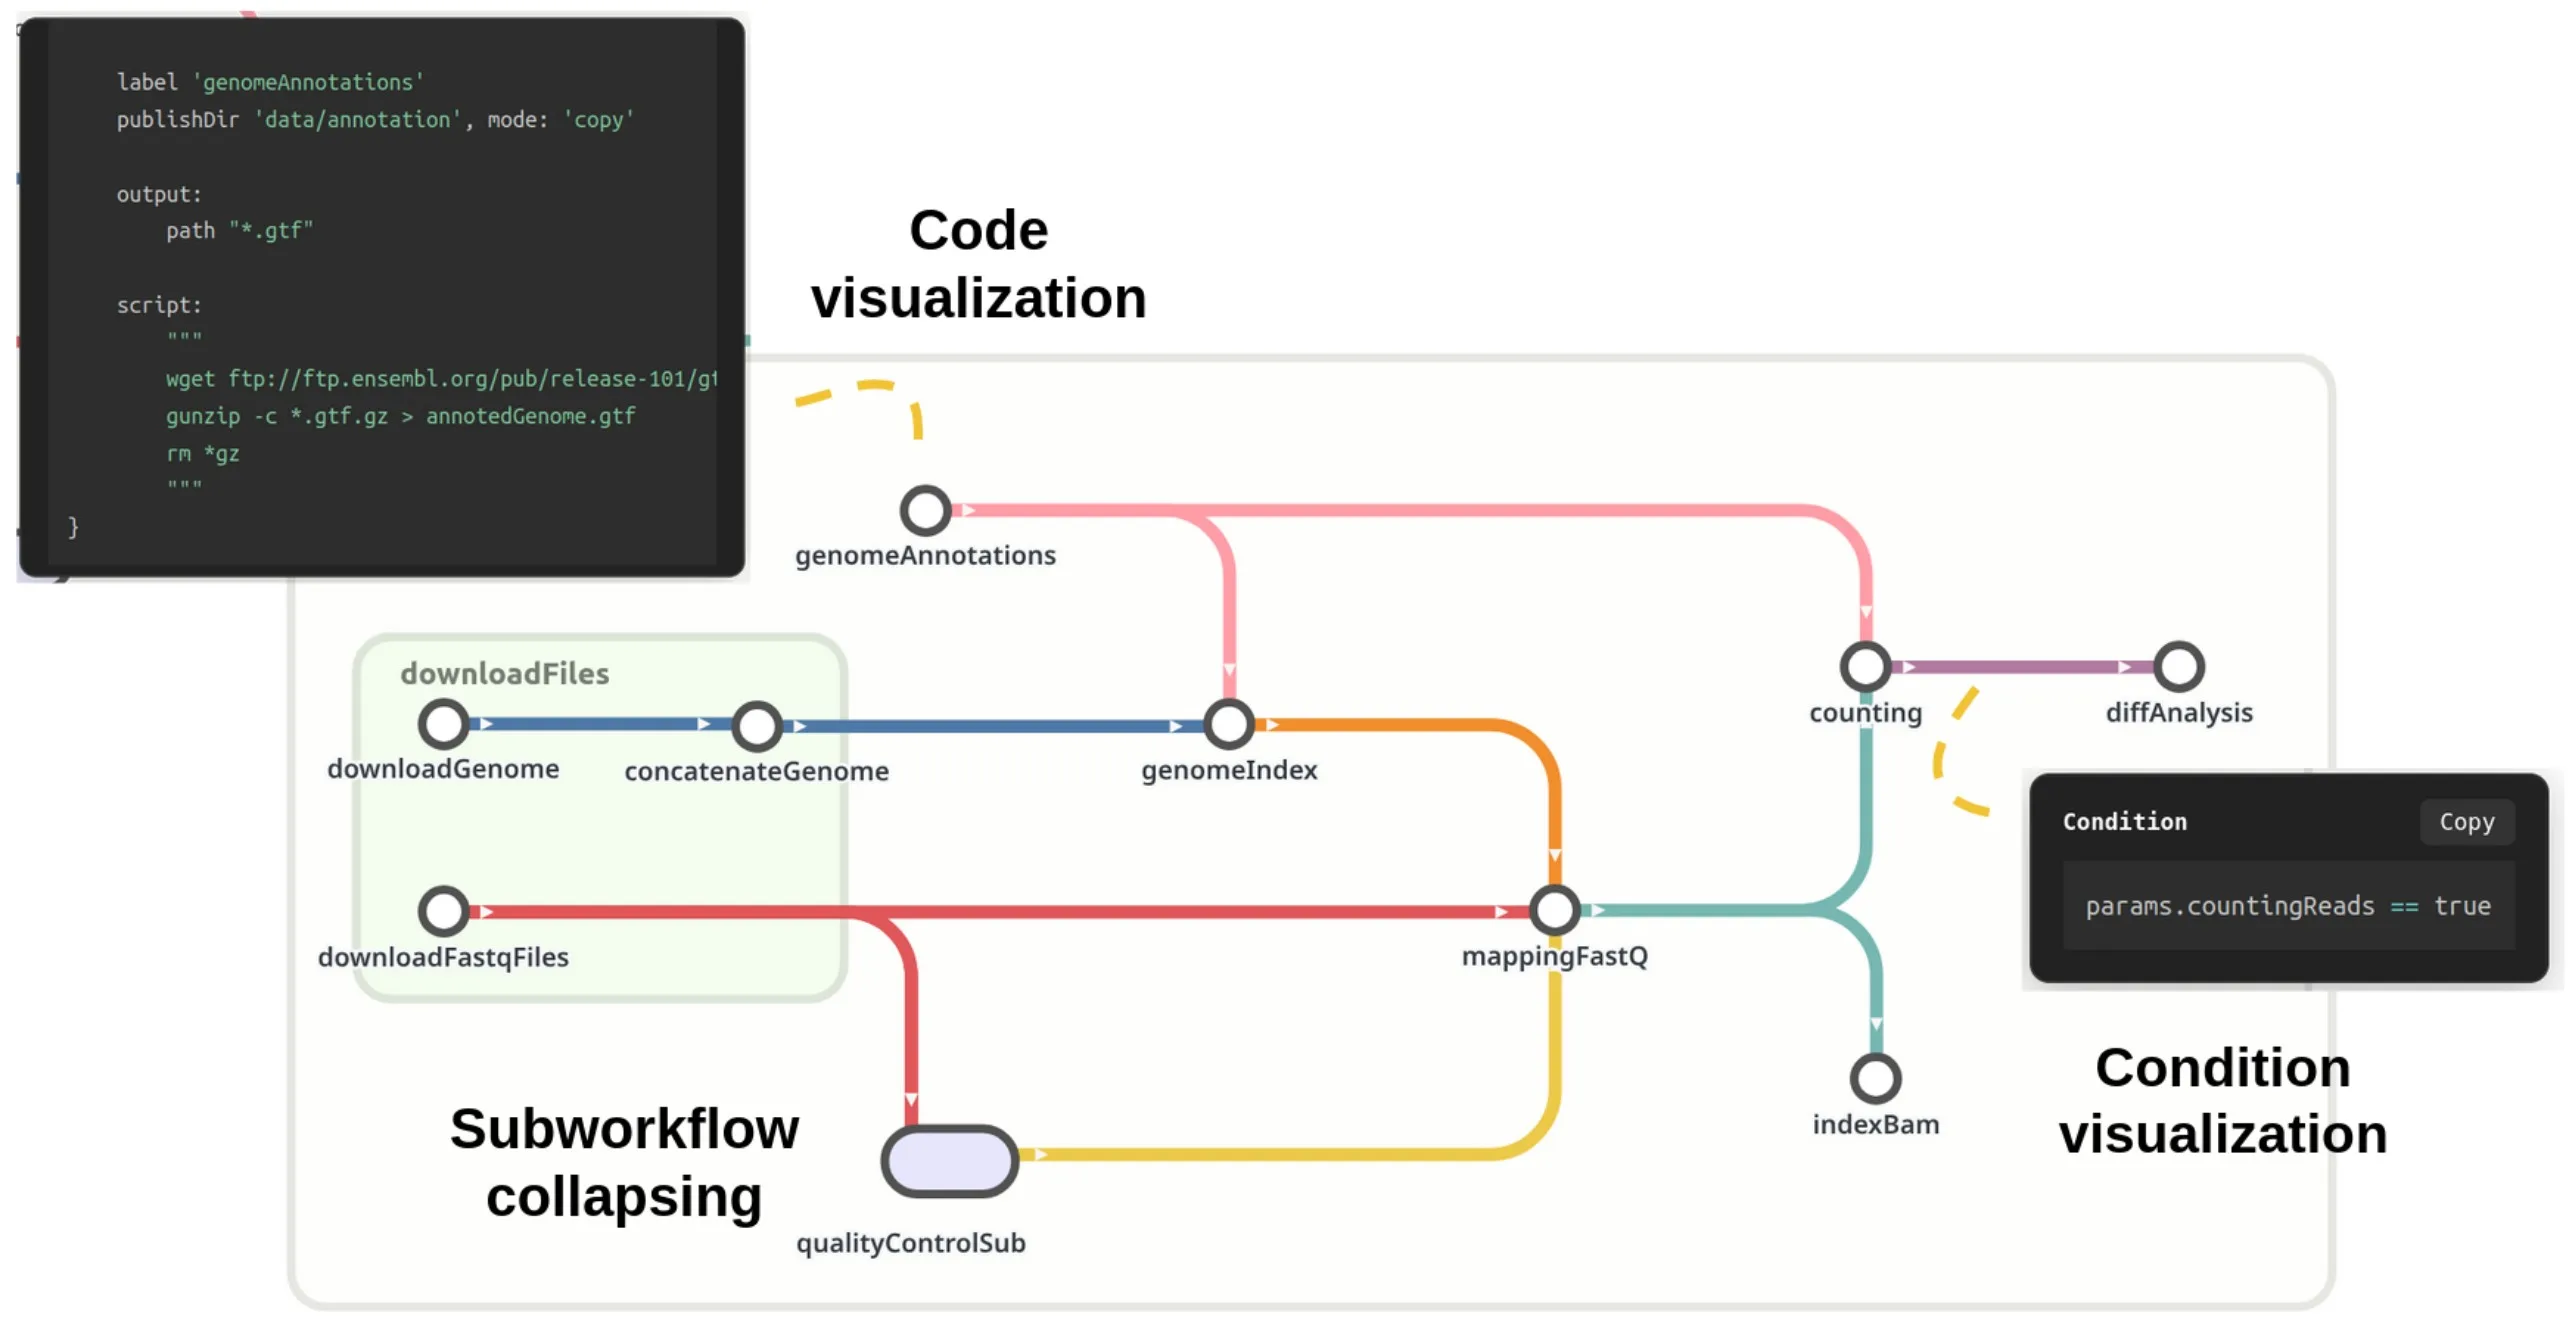
We present MetroFlow, a tool that automatically generates interactive metro-map representations of bioinformatics workflows.
Bioinformatics analyses increasingly rely on complex, multi-step workflows that are difficult to understand and reuse. Their logic, execution order, conditional branches, and inter-step dependencies are rarely self-evident, even to experienced practitioners, a comprehension barrier that directly limits reuse and proper interpretation of results.
Visualization is critical to address this challenge, as it can surface structure and data flow hidden in code. Practitioners naturally tend to sketch workflows as hand-drawn metro-maps, suggesting an intuitive match between this representation and workflow structure. MetroFlow automates this visualization process, preserving familiar visual conventions while adding scalability and multi-level interactivity.
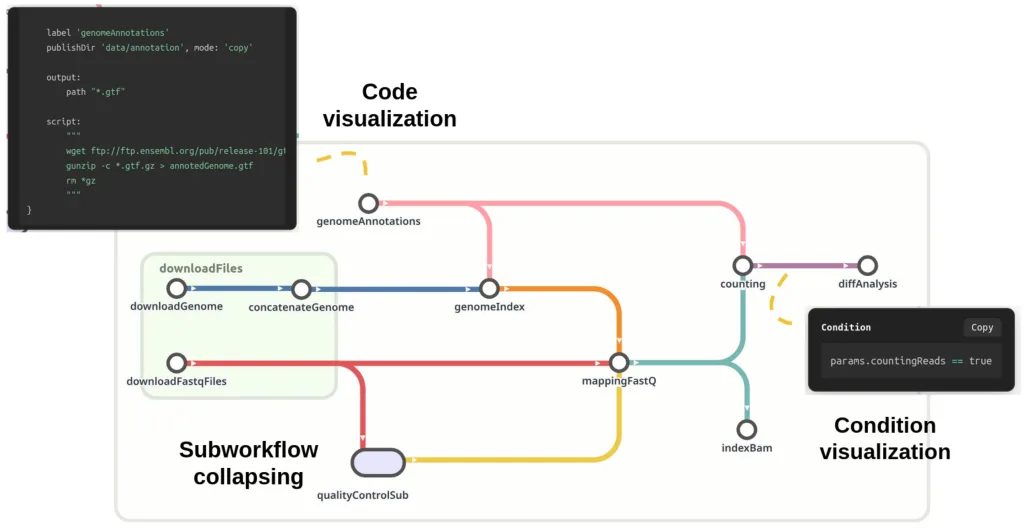
In this work, we evaluate MetroFlow’s effectiveness through a user study with workflow practitioners. Results indicate that, compared to the baseline, participants using MetroFlow (1) more accurately identified workflow steps and their ordering, (2) completed tasks faster in four out of five cases, (3) reported lower perceived difficulty, and (4) expressed greater confidence in their answers.
This collaboration was a wonderful opportunity to explore a new research area, and I’m grateful to have been invited to contribute.