User interfaces rely on rules that govern how users create, organize, and transform content. We call these rules structure. While structure enables functionality, its rigid enforcement often conflicts with user intentions, particularly in productivity and creative workflows. As generative systems increasingly produce and adapt structure on behalf of users, there is a clear need for a vocabulary to reason about structural behavior. We introduce Structural Interaction, a framework that makes structure a primary object of design. We model the user interface as a directed graph of elements and rules, and characterize rule behavior along two orthogonal dimensions: rigidity (how much a rule can be shaped) and enforcement (how much it can yield during interaction). Four values per dimension generate a 16-cell design space. Through two use cases, we show how the framework diagnoses structural limitations in existing interfaces and guides the design of solutions operating independently on each dimension.
Continue reading Structural Interaction: Shifting the Focus of User Interface Design
 Anne-Flore Cabouat
DIS PWiP 2026 acceptance “Bridging Educational Theories of Cognitive Load to Visualization Design and Evaluation”
Our paper “Structural Interaction: Shifting the Focus of User Interface Design” was accepted to the DIS Provocation and Works-in-Progress track. Vincent Cavez will present this work at DIS ’26 in Singapore. Continue reading DIS PWiP 2026 acceptance “Bridging Educational Theories of Cognitive Load to Visualization Design and Evaluation”
CHI 2026 in Barcelona
I attended the CHI 2026 conference in Barcelona with the Aviz team.
I participated in the STAR workshop (Science and Technology for Augmenting Reading), where I presented our work on Readability as a multi-measure construct in data visualization. Continue reading CHI 2026 in Barcelona
Readability as a multi-measure construct in data visualization
In this paper, we argue that readability cannot be meaningfully discussed without considering multiple complementary measures, and that relying on a single measure constitutes an epistemological choice that constrains the conclusions that can be drawn.
Continue reading Readability as a multi-measure construct in data visualizationDagstuhl seminar Psychology × Visualization
Very grateful for the invitation to this Psychology × Visualization Dagstuhl seminar, which offered a wonderful chance to meet fascinating people and engage in inspiring conversations. Continue reading Dagstuhl seminar Psychology × Visualization
Joining the AFIHM board
Honored to join the board of the Francophone HCI Association (AFIHM), after a year and a half as co-organizer of their Young Researchers Working Group (GT JCJC). Continue reading Joining the AFIHM board
VIS 2025 in Vienna
I attended the VIS 2025 conference in Vienna with the Aviz team.
I served as a student volunteer during the event.
I also presented our work on Bridging Educational Theories of Cognitive Load to Visualization Design and Evaluation at the 4th EduVis workshop. Continue reading VIS 2025 in Vienna
RJMI 2025
I participated in the Rendez-vous des Jeunes Mathématiciennes et Informaticiennes (RJMI) as part of the Inria Saclay scientific communication team. I had the pleasure of creating and leading an activity that took young women from an unplugged Nim game to its algorithmic implementation, connecting hands-on play, coding, and outcome visualization. Continue reading RJMI 2025
Fête de la science 2025
I participated in the Fête de la Science as part of the Inria scientific communication team. This year, I had an especially great time introducing statistical learning through an unplugged Nim game. This simple activity uses marbles to show how a machine can learn a winning strategy from simple repeated interactions. Continue reading Fête de la science 2025
Bridging Educational Theories of Cognitive Load to Visualization Design and Evaluation

We explore the validity and applicability of educational and cognitive science theoretical frameworks for designing and evaluating climate data visualizations.
Continue reading Bridging Educational Theories of Cognitive Load to Visualization Design and EvaluationAn Autoethnography on Visualization Literacy: A Wicked Measurement Problem
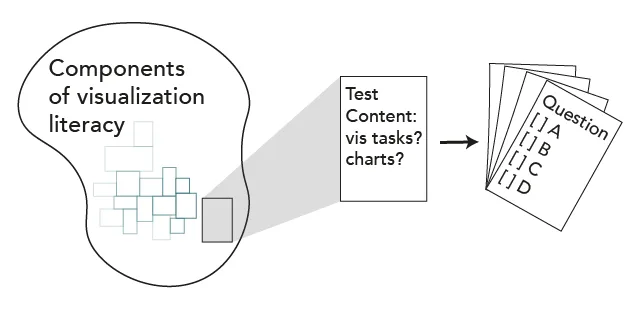
We contribute an autoethnographic reflection on the complexity of defining and measuring visualization literacy (i.e., the ability to interpret and construct visualizations) to expose our tacit thoughts that often exist in-between polished works and remain unreported in individual research papers. Our work is inspired by the growing number of empirical studies in visualization research that rely on visualization literacy as a basis for developing effective data representations or educational interventions. Researchers have already made various efforts to assess this construct, yet it is often hard to pinpoint either what we want to measure or what we are effectively measuring.
EduVIS 2025 acceptance “Bridging Educational Theories of Cognitive Load to Visualization Design and Evaluation”
Our workshop paper “Bridging Educational Theories of Cognitive Load to Visualization Design and Evaluation” was accepted at the EduVIS 2025 workshop. I will present this work in Vienna during IEEE VIS week 2025. Continue reading EduVIS 2025 acceptance “Bridging Educational Theories of Cognitive Load to Visualization Design and Evaluation”
VIS 2025 acceptance: “An Autoethnography on Visualization Literacy: A Wicked Measurement Problem”
Our full paper “An Autoethnography on Visualization Literacy: A Wicked Measurement Problem” was accepted at IEEE VIS 2025. Lily Ge will present it at the VIS conference in Vienna. Continue reading VIS 2025 acceptance: “An Autoethnography on Visualization Literacy: A Wicked Measurement Problem”
LISN Ph.D. days 2025 presentation
I presented my Ph.D. topic at the LISN Ph.D. day 2025 in Université Paris-Saclay in Orsay. Continue reading LISN Ph.D. days 2025 presentation
Doctoriales 2025 i3 presentation
I presented my work for the i3 Doctoriales 2025 in École des Mines de Paris. Continue reading Doctoriales 2025 i3 presentation
EuroVA 2025 acceptance “We should change how we measure user experience in visual analytics systems”
Our short paper “We should change how we measure user experience in visual analytics systems” was accepted at EuroVA workshop 2025. Eliane Zambon Victorelli will present it at EuroVis 2025. Continue reading EuroVA 2025 acceptance “We should change how we measure user experience in visual analytics systems”
Visiting the VISUS Lab at University of Stuttgart
I visited the Visualization Research Center in Stuttgart with Petra Isenberg.
I presented our work on PREVis to the team there.
PREVis paper at VIS 2024 (online)
I presented our paper “PREVis: Perceived Readability Evaluation for Visualizations” at IEEE Visualization 2024 (online).
[icon name="trophy" prefix="fas"] This work received a Best Paper Honorable Mention Award.
I also served as a student volunteer during the event. Continue reading PREVis paper at VIS 2024 (online)
Starting my PhD
I started my PhD to explore readability in data visualization in the Aviz group, under the supervision of Petra Isenberg (Inria, LISN, Université Paris-Saclay) and Samuel Huron (Telecom Paris, Institut Polytechnique de Paris, CNRS i3). Continue reading Starting my PhD
PREVis: Perceived Readability Evaluation for Visualizations

Although readability is recognized as an essential quality of data visualizations, so far there has not been a unified definition of the construct in the context of visual representations. As a result, researchers often lack guidance for determining how to ask people to rate their perceived readability of a visualization. To address this issue, we engaged in a rigorous process to develop the first validated instrument targeted at the subjective readability of visual data representations. Our final instrument consists of 11 items across 4 dimensions: understandability, layout clarity, readability of data values, and readability of data patterns.
A cognitive load approach to designing and evaluating data visualizations

Visual representations of data are increasingly prevalent, but we lack a detailed theoretical framework to explain what factors make easy or difficult to read and understand; nor do we know how such factors can impact data visualizations’ efficiency as learning material.
In this Master’s Thesis, I address this gap by exploring the validity and applicability of Cognitive Load Theory, an educational and cognitive science theoretical framework, for designing and evaluating data visualizations. Beyond empirical findings, I also contribute an interdisciplinary perspective on the cognitive processing of visualizations, and I discuss implications in assessing readability in visualization studies.
Continue reading A cognitive load approach to designing and evaluating data visualizationsPosition paper at CHI Workshop on Visualization Literacy
I presented our position paper “A case to study the relationship between data visualization readability and visualization literacy” remotely at the Workshop: Toward a More Comprehensive Understanding of Visualization Literacy @CHI24 and in person at the para.CHI’24 Paris event. Continue reading Position paper at CHI Workshop on Visualization Literacy
A case to study the relationship between data visualization readability and visualization literacy (position paper)
Only with reliable and relevant measures can we assess how a potential factor affects a reader’s performance; accordingly, only with appropriate measuring instruments can we start to investigate the tight web of interactions between individual characteristics, features of the visual design, and reading tasks requirements. As we slowly progress in our understanding of how people process information from data visualization, and based on these improved tools and other developments, we can further develop theoretical foundations in data visualization.
This position paper was accepted at ACM CHI24 Workshop: Toward a More Comprehensive Understanding of Visualization Literacy.
Continue reading A case to study the relationship between data visualization readability and visualization literacy (position paper)Fête de la science 2023
I participated in the Fête de la Science as part of the Inria scientific communication team. This year, I had an especially great time introducing statistical learning through an unplugged Nim game. This simple activity uses marbles to show how a machine can learn a winning strategy from simple repeated interactions. Continue reading Fête de la science 2023
Starting my M2 internship
I started a follow-up 6 months internship at the Aviz group under the supervision of Tobias Isenberg (Université Paris-Saclay, CNRS, Inria, LISN) to complete the development of a scale to assess perceived readability in data visualization. Continue reading Starting my M2 internship
Open Questions about the Visualization of Sociodemographic Data

The visualization research community engaged a reflection on how to represent data about people. This work collects a set of open research questions and highlights some future research directions.
Florent Cabric, Margrét Vilborg Bjarnadóttir, Anne-Flore Cabouat, and Petra Isenberg. Open Questions about the Visualization of Sociodemographic Data. In Workshop on Visualization for Social Good (VIS4Good). IEEE. 2023.
Continue reading Open Questions about the Visualization of Sociodemographic DataPondering the reading of visual representations

We draw from the cognitive psychology literature on models of reading text, and describe a knowledge gap for cognitive processes at work when reading visual representations of data.
Continue reading Pondering the reading of visual representationsStarting M1 internship
I started a 6 months internship at the Aviz group under the supervision of Tobias Isenberg (Université Paris-Saclay, CNRS, Inria, LISN). Continue reading Starting M1 internship