
We explore the validity and applicability of educational and cognitive science theoretical frameworks for designing and evaluating climate data visualizations.
Specifically, we are interested in using well-known frameworks from other domains to learn about how the subjective readability of a visualization relates to the perceived cognitive load required to acquire knowledge from it. To that end, we conducted an online randomized study in which each participant performed learning tasks on two different data visualizations. One was presented in three successive parts, following the segmenting principle from the Cognitive Theory of Multimedia Learning, and the other was presented as a single image.
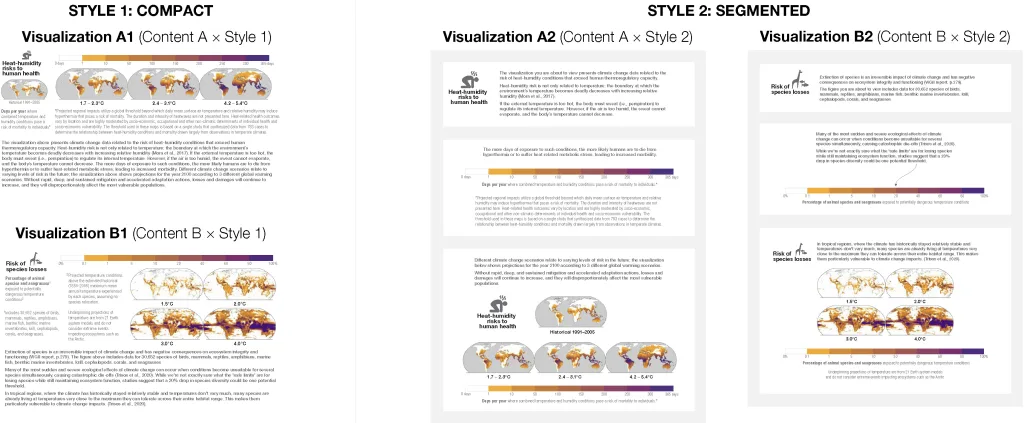
Although most learners preferred the segmented style, this treatment did not significantly affect the overall mental effort they reported. Subjective measures of extraneous cognitive load, however, significantly and negatively correlated with visualizations’ perceived readability measures.
In other words, if a learner found a visualization more readable, they felt it required less mental effort to parse relevant information from it for learning. In addition to a qualitative analysis of learners’ preferences, we also contribute an interdisciplinary perspective on cognitive processing of visualizations and a discussion of implications for designing and evaluating data visualizations beyond educational contexts.
A short intro to cognitive load in data visualization
This is the talk I will present during the EduVis workshop at VIS 2025.
Four learning scenarios in Cognitive Load Theory
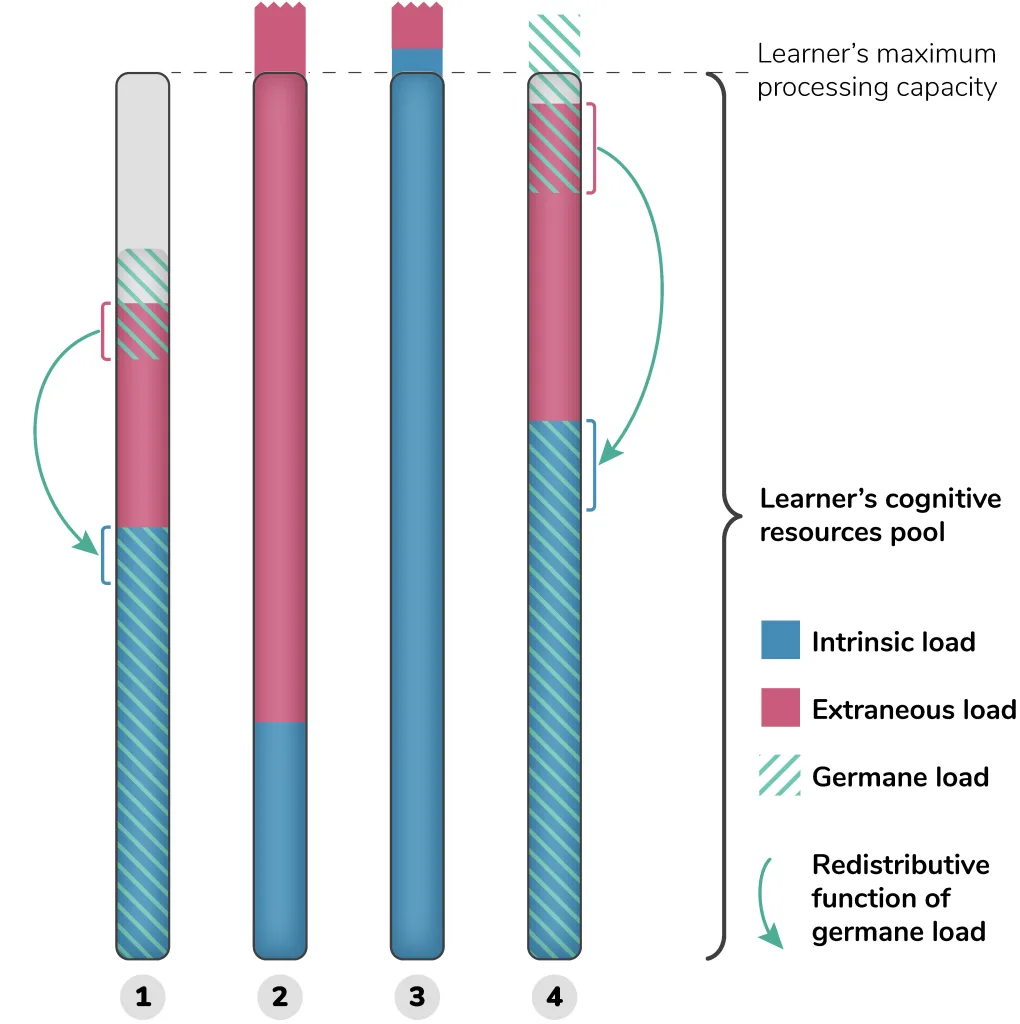
1 – After accounting for intrinsic and extraneous load, the learner has sufficient cognitive resources available to filter out irrelevant information and engage in effective learning.
2 – Extraneous load is too high: the learner is overwhelmed by the way information is presented or by irrelevant details. Example solutions: remove irrelevant content, find a representation that is easier to process for this learner, or improve the learner’s ability to process the chosen type of representation (e.g., in data visualization contexts, by increasing the learner’s idiom-specific visualization literacy, or their ability to leverage the system’s interactive features).
3 – The knowledge to acquire is intrinsically too complex for this learner, leading to cognitive overload and loss of information. Example solutions: build the learner’s prior knowledge on the topic or adjust the learning goal.
4 – Once intrinsic and extraneous loads have been addressed, the learner is operating near their cognitive capacity. Their available bandwidth for germane processing is constrained, possibly hindering their ability to redirect cognitive resources from extraneous to intrinsic processing. Example solutions: if extraneous load has already been reduced to a minimum, provide scaffolds for germane processing, e.g., by breaking the learning task into smaller steps or by supporting meta-cognitive strategies.
Anne-Flore Cabouat, Lorenzo Ciccione, Tobias Isenberg, Samuel Huron, Petra Isenberg. Bridging Educational Theories of Cognitive Load to Visualization Design and Evaluation. In Visualization Education, Literacy, and Activities (EduVis). IEEE, Nov 2025, Vienne, Austria.